Guiding Principles for Developer Tools
Just like almost anything else in software engineering, we don’t have a precise definition for the term microservice. This lack of formality doesn’t make the term worthless, however. There are a few useful characteristics we can infer whenever someone says they have an architecture that follows this paradigm. One such characteristic of “microservices-based architecture” is that they have a lot of small, independent, pieces of software—the so-called services.
With so many small services to build and manage, I find it useful to think about this as the economics of microservices. Basically, the organization needs to make it “cheaper” to build and operate products following the microservices way than adding “just one more feature” to the monolith.
Applying this mindset, something organizations quickly realize is that they need to invest in some areas usually neglected in more traditional, monolithic architectures. Building on prior art by Martin Fowler, I wrote a detailed article on this. Here is a handy list of areas that require some extra investment before adopting microservices:
- Rapid provisioning of compute resources
- Basic monitoring
- Rapid deployment
- Easy to provision storage
- Easy access to the edge
- Authentication/Authorization
- Standardized RPC
These days, cloud providers and open source projects offer great tools to minimize the need for custom solutions for most of the listed above. Nevertheless, it is still the case that an organization needs to build some tooling. Usually, we need some glue code to fill in gaps between off-the-shelf tools, to enforce conventions, or offer a more productive workflow to engineers.
I have spent the last few years building and such tools, for both internal users and as products with paying customer. Sometimes, this work was done by a product engineering team, sometimes by an infrastructure team. To simplify our vocabulary, I will call this type of work platform.
Over time, my experience in platform work has led me to compile a list of principles that like to follow when building developer tooling, which I document in this article.
Know your audience(s)
It is very tempting for teams building dev tools to try and build the tools that they would love to have. Well, just like with any other type of product development, teams building dev tools need to take a step back and understand that they are not the user.
If someone is part of a platform team working on developer tooling, this person likely has interest, skill, and experience on how to work with infrastructure. You should not expect the same from people who are going to use the tools this team creates.
One way to understand whom you are building your tooling for is to run quarterly surveys, in which engineers self-assess their proficiency levels in various technologies used by the organization (e.g., AWS Lambda, microservices, Node.js, Go, MySQL, etc.). Getting people to respond to surveys like this is always challenging, but making a survey anonymous and a self-assessment tends to increase engagement levels.
The survey should be straightforward; here is a screenshot of the survey my team used at Meetup:
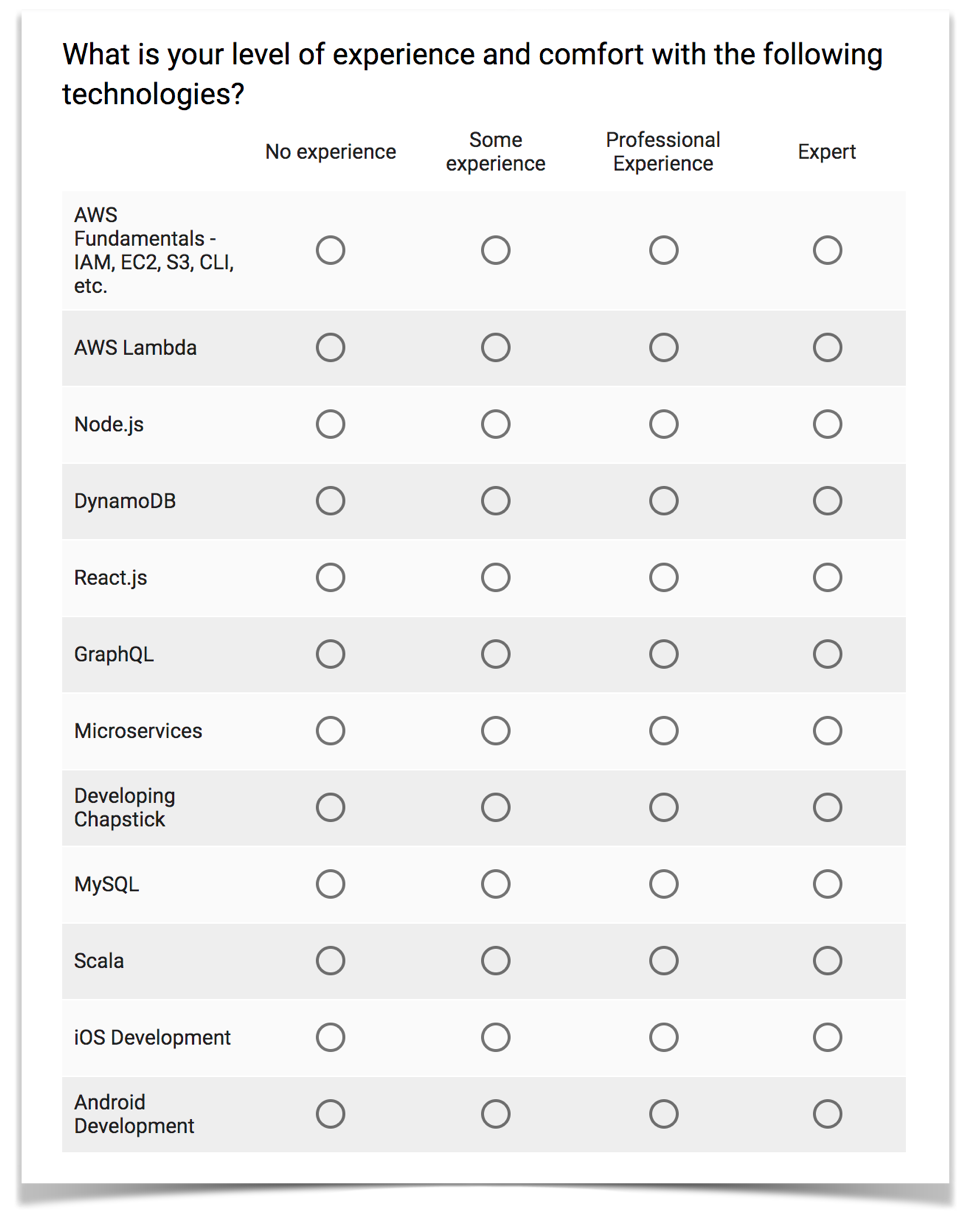
Data from a survey like this is subjective and should be combined with other quantitative and qualitative sources of feedback. Still, this is a great way to draw a map that helps you visualize the gaps in skill and experience you might have. The team should use the results to help build and prioritize their backlog and roadmap.
At Meetup, for example, results coming from the survey above showed that most engineers had some level of experience with Serverless technologies such as DynamoDB and AWS Lambda. Surprisingly, only a few people declared to know about fundamental topics such as IAM, VPC, CloudFormation, etc. Based on this split, the platform team decided to build first features that make it easier to use the latter and postpone working on Serverless-specific topics.
Prioritizing engineers not well-versed in infrastructure doesn’t mean that we could ignore infrastructure-savvy folks. There are many different ways to make sure you don’t alienate them from the work, but the most important step the platform team needs to take is to make it clear to infrastructure experts that if you know enough about infrastructure to have strong opinions about its internals, you probably aren’t part of the main audience for the tool.
However, even if they aren’t the target audience, the different cohorts must coexist. It is on the platform team to make an effort to allow the experts to integrate their tools and workflow with the tooling they create. This goal is not always possible, but you’d be surprised with how much common ground can be reached with a little bit of goodwill from both sides.
At Meetup, before we added any major feature to our developer tool, we would create a write-up, often started as an RFC, describing it in detail. It would, for example, describe that a new feature that creates AWS Accounts for users would automatically add such and such roles, with such and such permissions, and follow a specific naming convention. This spec allowed folks like our data science team, who had already invested a lot on their own Terraform-based automation, to make sure that their infrastructure was compatible with the rest of the organization.
Collect and monitor usage metrics
After spending most of my career in product engineering, something that shocked me when I started working on infrastructure products was how little information about our users’ habits and usage of the platform the team had. We relied a lot on asking user feedback, sometimes as user panels, others by using inviting a few users to a usability lab. We never observed what people were doing in their normal day-to-day lives; all we knew was what they told us or what we saw in a lab.
As an attempt to change that, whenever I am building a developer tool, I make sure that we send usage metrics to some analytics database. The platform team can then analyze this data and find interesting insights about how people use their tools in the real world, performing real tasks. By doing this, you may, for example, notice that your users still rely too much on the AWS web interface for something that your command-line tool already provides, that some commands are always run in sequence and could be collapsed in one, or that a given feature users needed to run many times a day is too slow and probably frustrating your users.
Every time a tool is used, it sends to the analytics database at least the full command line invoked by the user, everything that was written to STDOUT and STDERR, and how long the operation took. You might also want to send any relevant environment variables, who is the current user, and from which host is this being executed. Think of this as Google Analytics for your command-line tools.
At Meetup, running our tools with the -v flag showed to users what information was sent to the server (it’s in the last line of the output):
One interesting challenge is that internal tools are unlikely to have enough usage metrics to have statistically significant data. They often fall into what is sometimes called “small data,” which roughly means that the dataset produced is small enough to be understood by humans but not large enough to apply those neat statistical methods that modern product management loves.
That is why, while it is often interesting to analyze the usage metrics of your tooling, it is probably more important to analyze the impact they have. At Meetup, we measured this by tagging every AWS resource touched by our tooling with some metadata that allowed us to see that this particular resource had been created or updated by our product. We could then quickly visualize how much of our infrastructure was managed by our tooling versus using alternative ways. This information was fundamental when defining our projects and priorities for the platform team.
A few practical considerations when implementing metrics for your tooling:
- Make sure you add a flag that allows users to bypass sending analytics data to the server. At Meetup this is achieved by the
--incognitoflag that every command honors - Your tools should never take passwords or other sensitive information as parameters or output them, but in case you absolutely have to do so please make sure that you do not collect this information in plain text in your logs
- Failure in sending analytics shouldn’t prevent the tool from working. If it can’t send the data, you might want the tool to save the logs on local disk to be sent later. Whatever you do, though, do not throw an error at the user just because logs can’t be sent to the server
Avoid creating new abstractions, simplify existing ones
When I headed product engineering at DigitalOcean, we were always concerned about how our could we offer sophisticated products to our users without requiring them to read a 200-pages manual to find out if they needed its features at all.
One option to deal with this challenge was to wrap infrastructure-heavy concepts as higher-level abstractions. For example, instead of selling VMs and object storage as separate primitives, we could package them all together as a single product, something like what Google AppEngine did back in the day.
This idea had its appeal, but something that even Google suffered with back in the day (and AWS and others are experiencing as they evangelize Serverless computing), is that every time you do something like this you are not actually removing complexity, you are just replacing existing concepts with a whole new set of abstractions. Even if the older abstractions were complicated, there are probably thousands of StackOverflow questions, tutorials, books, etc. that document and explain them. Irrespective of how much simpler they might be, if you create new abstractions, it is on you to educate your userbase on how to use them.
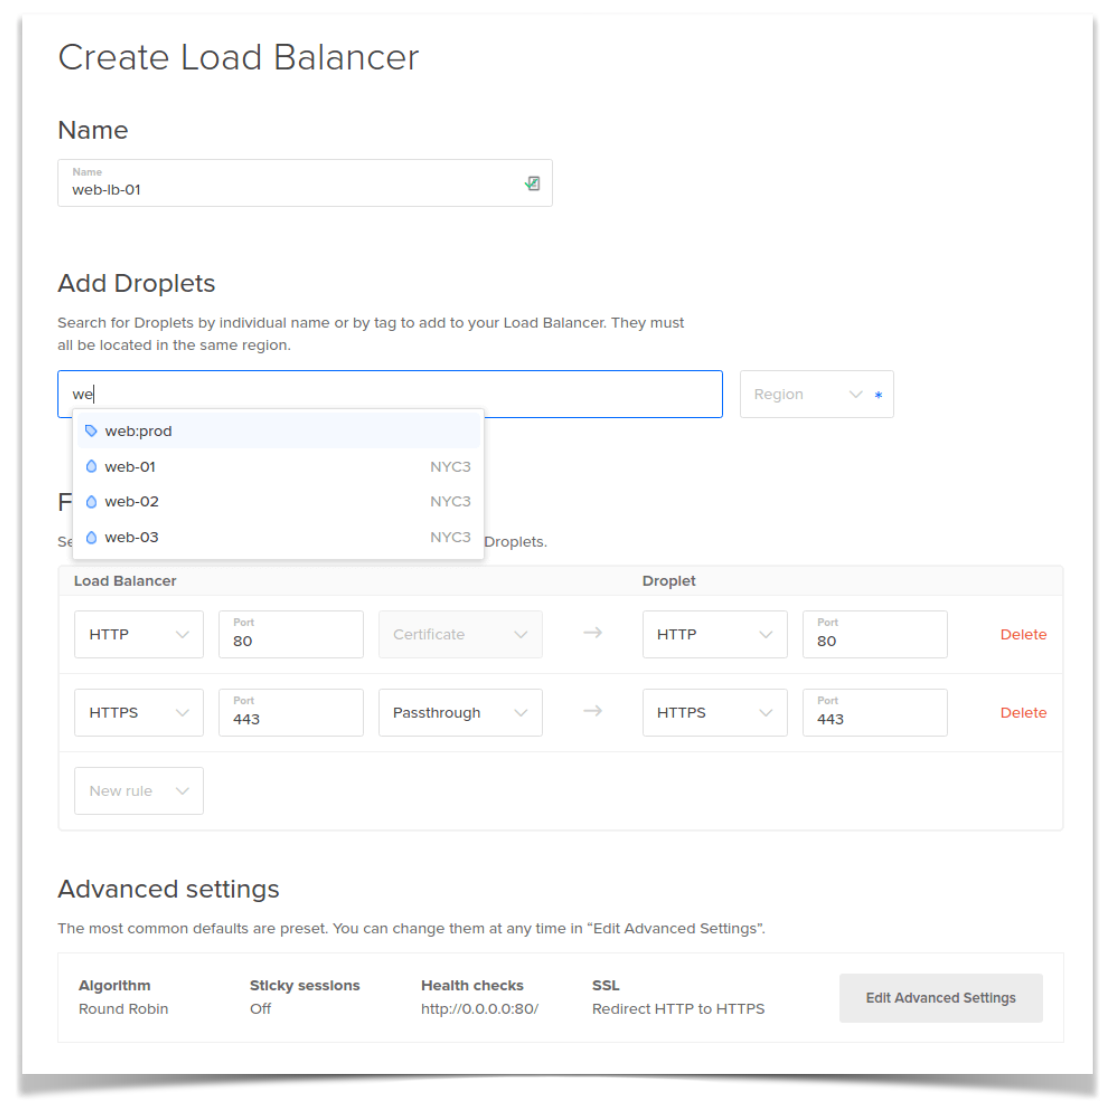
Instead, we decided to work with existing concepts as much as possible, and simplify how users interacted with them. As an example, the first version of our load balancer product was nothing more than a few VMs running HAProxy and managed by Terraform—nothing that users couldn’t already do on their own. Instead of exposing the complexities of these tools, though, we tried to create a clean user interface that didn’t try to be smart, it just removed any details that weren’t important for the majority of our users:
At Meetup, we have standardized on CloudFormation as our configuration management tool. Unfortunately, CloudFormation’s out-of-the-box user experience is awful. As an example, let’s say that you have a CloudFormation template named standard_user_and_permissions.yaml in your local directory. Here is what we needed to do to run this template using the aws command-line tool:
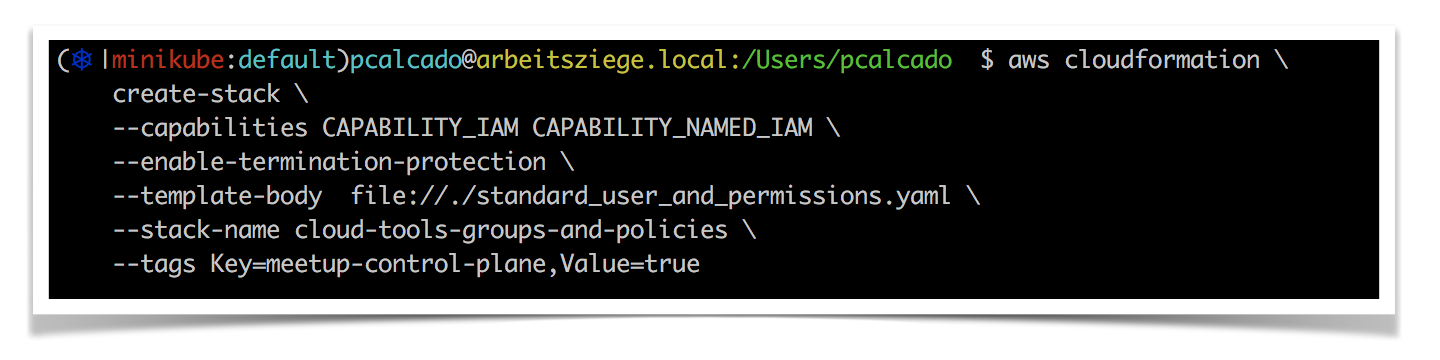
The only parameter in this very long command-line that is unique to the task is --template-body. Everything else is just metadata that one needs to add accordingly to Meetup’s conventions and standards for AWS.
Considering how often engineers performed this task during their day-to-day work, our platform team decided that this was worth automating. We added a create-stack option to our cloud-tools utility, and the new command looked like this:
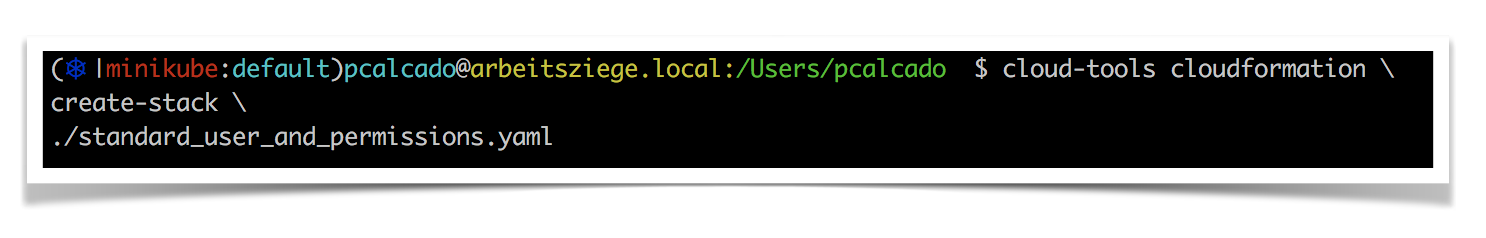
When building the feature above, our main goal was to avoid requiring engineers to remember and type each one of the arcane yet super important parameters. We figured out that we could infer everything we needed from things like AWS configuration file, environment variables, and directory structure conventions, which simplifies the user experience drastically.
We could take this a little further, and use more conventions and metadata to completely eliminate the need for engineers to write the CloudFormation templates—let’s be honest, they are mostly copied and pasted around. Even if this could streamline the workflow even further, We have decided to simplify, but not hide, CloudFormation.
One of the reasons for this decision was the educational argument discussed above—we had access to inexpensive or free educational resources and consulting on CloudFormation. Another big reason was that we have realized that the more we hide away a fundamental tool like CloudFormation, the harder it would be for us to adopt new features from AWS. If we use our own abstractions for configuration management, every time AWS releases a new feature our users would have to wait until the platform team adds support to it to our tools.
If we do not shy away from CloudFormation, we would be able to use new features as soon as AWS makes them available—granted, AWS is notorious for not adding new features to CloudFormation until after launch, but it would still take longer to do it ourselves.
Build on top of the existing user experience, do not try to hide it away
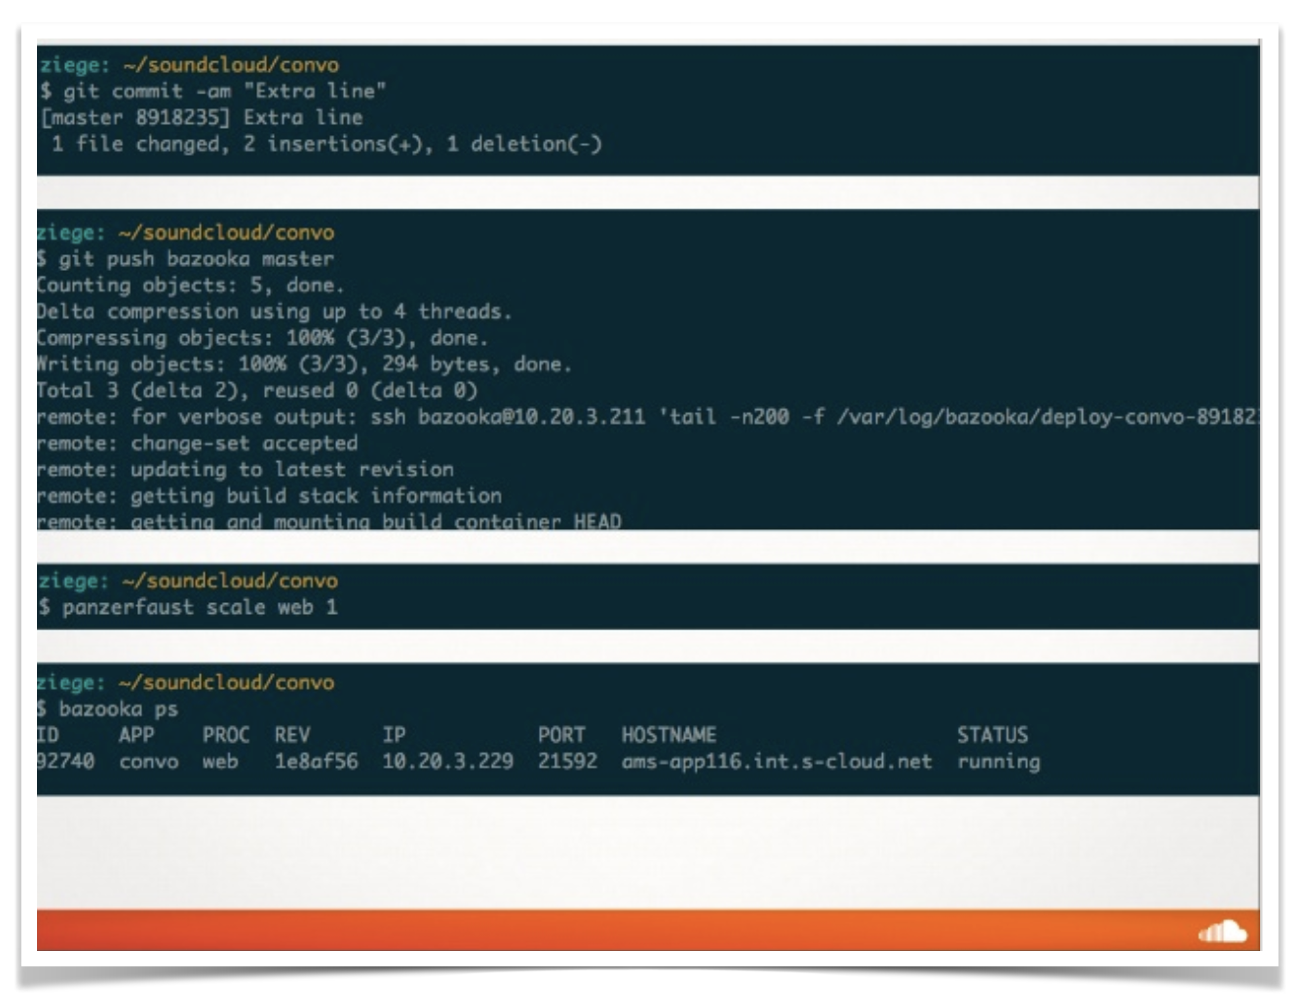
SoundCloud started heavily investing in container technology around 2011. This was years before Docker was released, so we had to develop our own tooling. Like most people back then, we used cgroups, Linux namespaces, and SquashFS images to build our container infrastructure. Containers were used only in production, during development folks would use their local machine’s environment and upon deploy, using git push, the platform would package the code as a container and deploy it. It was designed to offer an experience almost identical to Heroku’s, as this slide from a presentation I gave in 2013 shows:
This system has served us for many years and during our most extreme hyper-growth stages. Eventually, though, it became clear that adopting the Docker toolset would be extremely beneficial to us, especially as it would allow engineers to run containers on their development machines smoothly.
As we changed our platform, planned for this change, we faced the familiar challenge of keeping our engineers as productive as possible while we transition our platform to the new technology. One way we have found to achieve that was to invest in automation, creating tools that would make it super easy for people to perform some of our most everyday tasks, even if they had no idea what Docker was or how to use it.
As an example, here is the output of a tool we had that automatically created build pipelines in our Jenkins cluster:
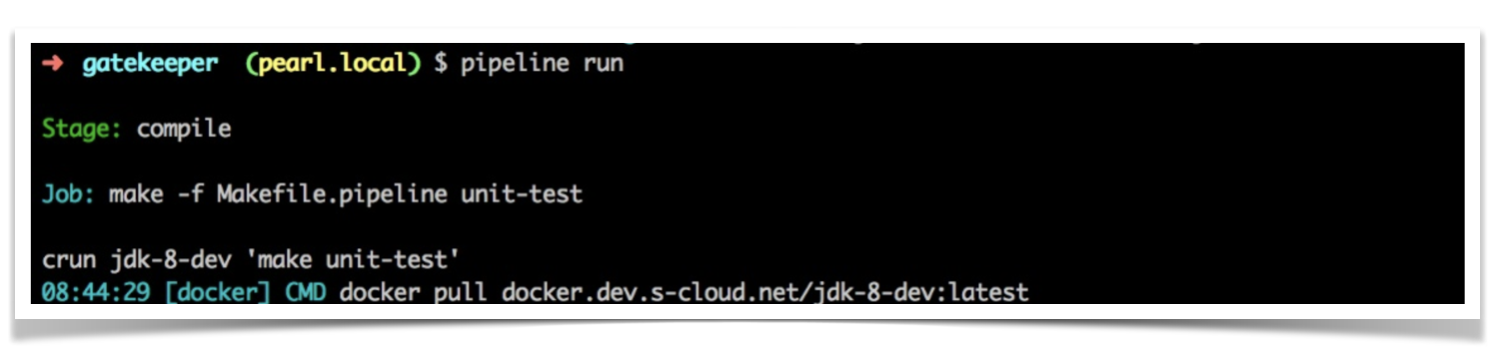
The pipeline tool shown above at work read a manifest file containing some metadata about the project and the Makefile.pipeline, which contains instructions about run to run the build—very similar to the role .travis.yml when using Travis CI.
Something interesting about the tool is that not only it uses the Docker command line as discussed in the previous section, but it also writes to STDOUT the full command line it invoked and the full output returned by the process it has spawned. At first, this was a debugging resource used by the platform team while developing these tools, but for some reason, it was never turned off before releasing the tool to our engineers.
One massive positive impact that this had was that it was a great way for engineers to get acquainted with Docker. I think it would be correct to say that everything I learned about how to use Docker back then was by observing what the tool was doing and how Docker would react.
This accidental feature was something that I have assimilated as a principle for all infrastructure tools.
Every tool we built at Meetup had a built-in “verbose” mode that showed users what AWS commands are being issued and what is returned. For example, if you want to see a list of AWS which OrganizationalUnits (basically a grouping of AWS accounts) belong to which teams, you would typically run this command:
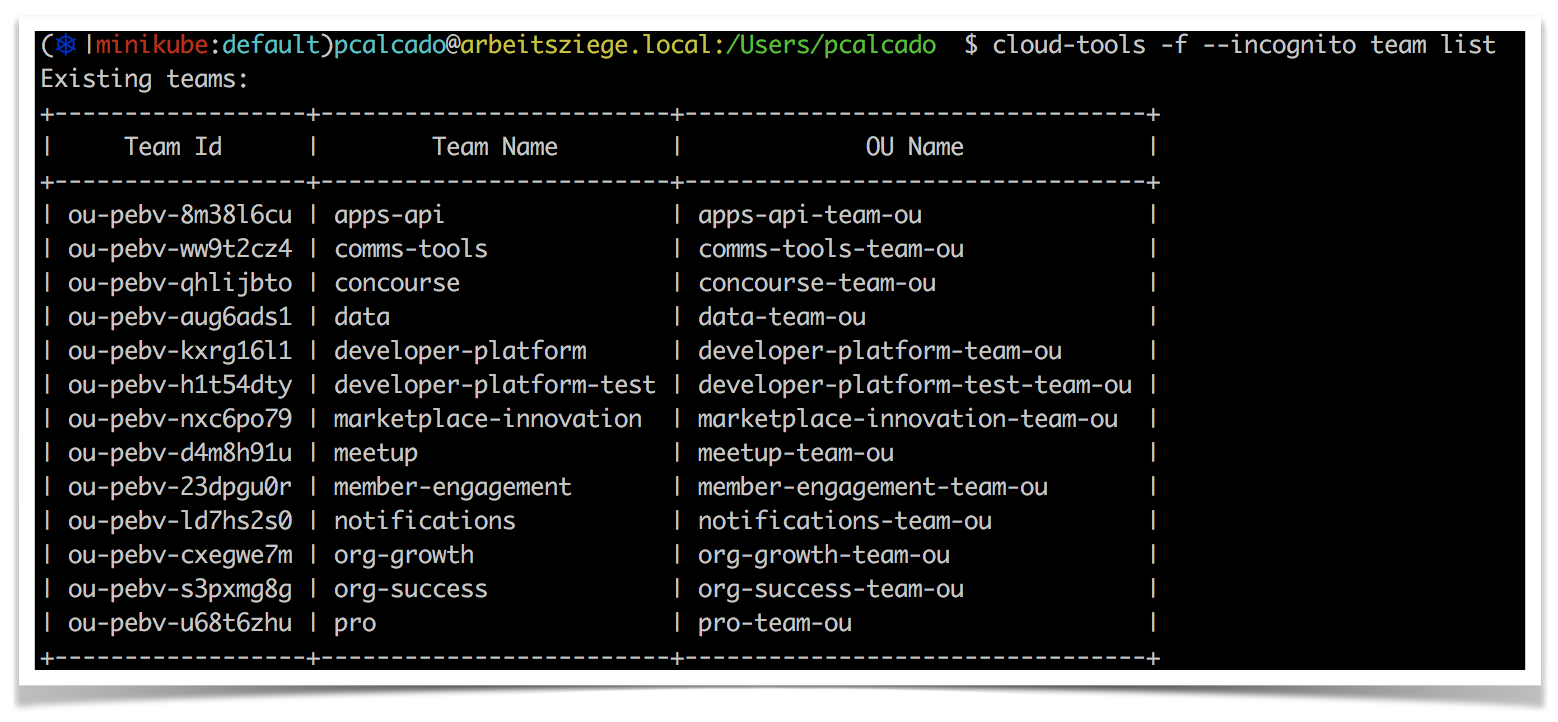
However, if you added the -v flag to the line above, it would output everything that has to do with the AWS commands:
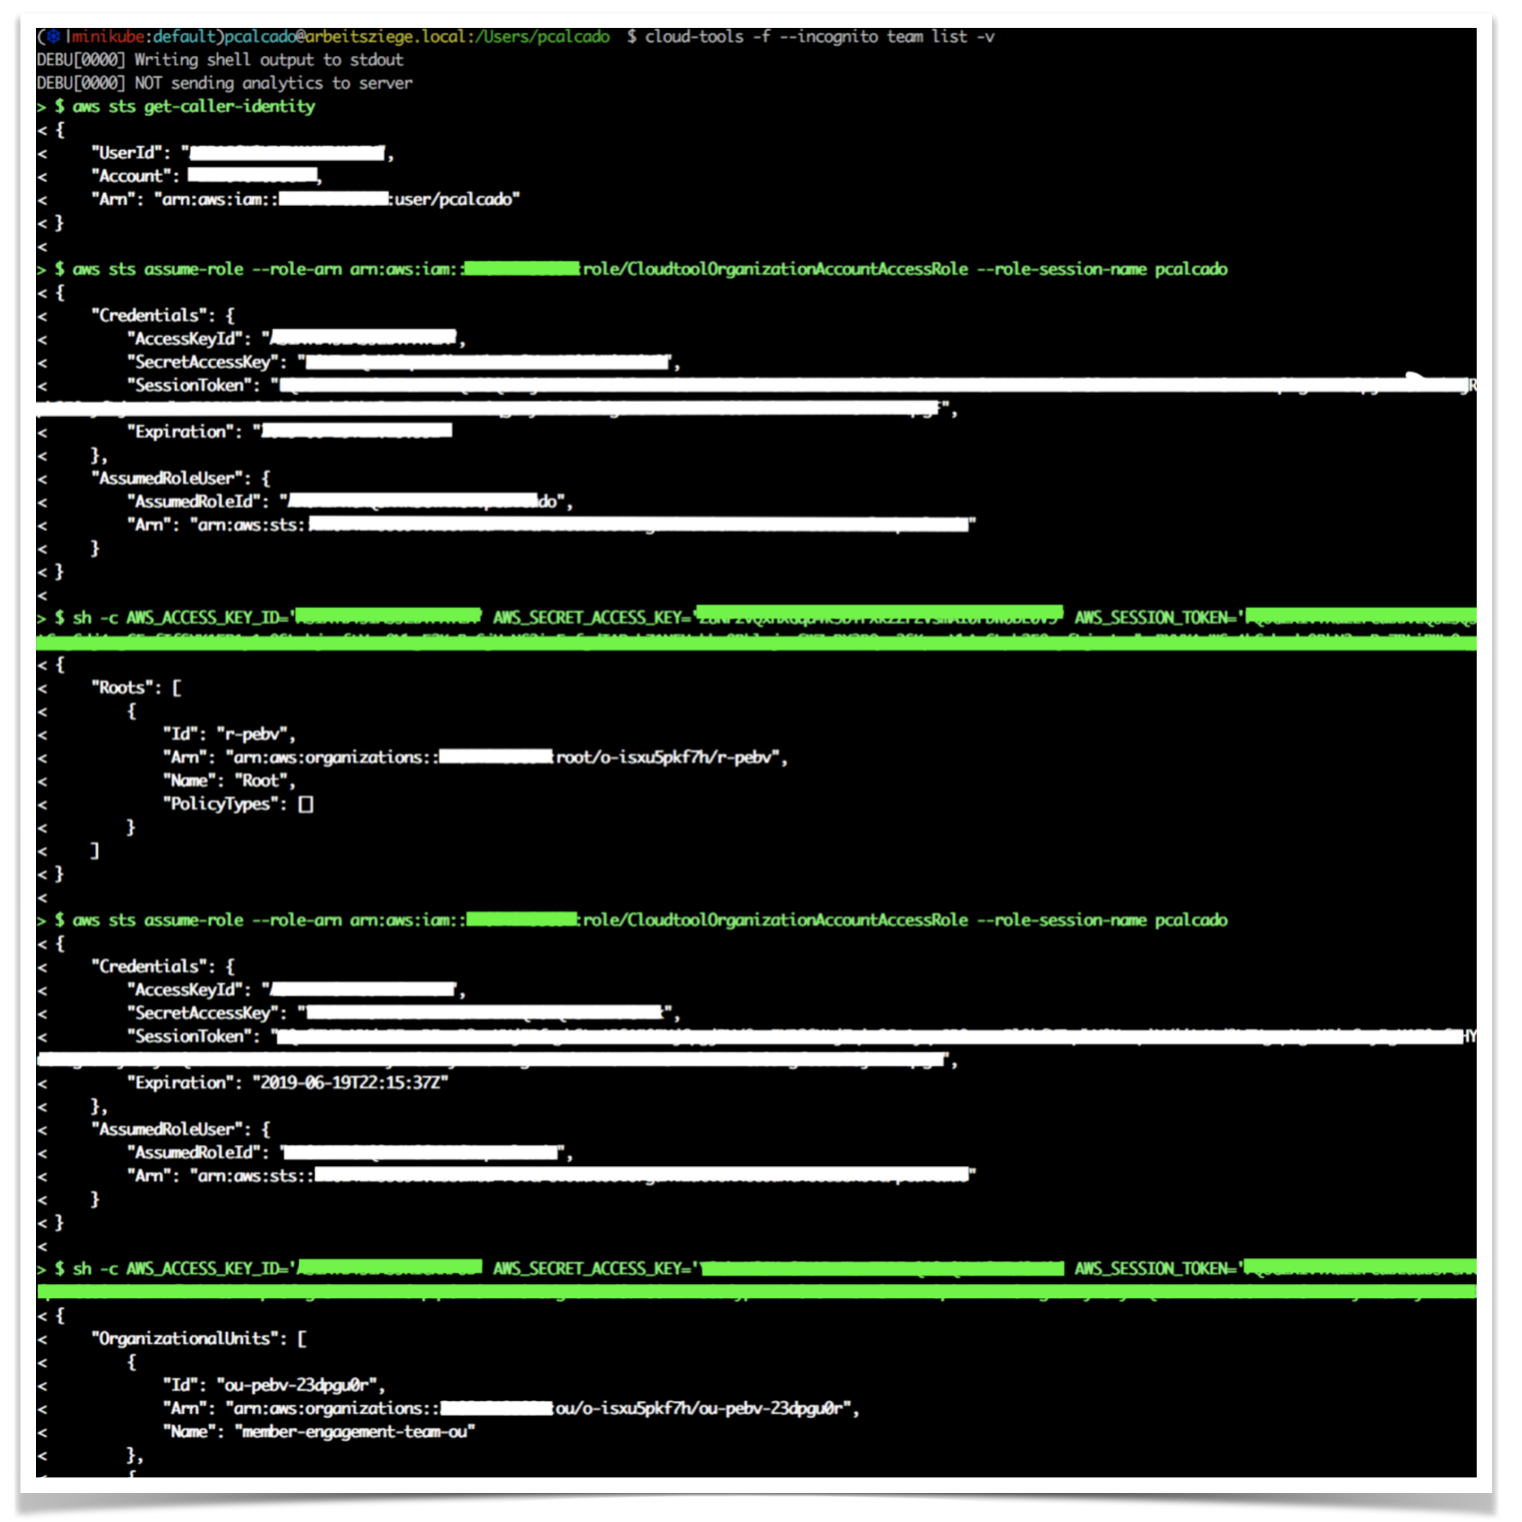
Given how low-level the aws command-line commands tend to be, this tends to be very noisy. That is why it is not enabled by default.
As discussed, exposing users to the ins and outs of the underlying platform is an efficient and inexpensive way to teach by example. Another benefit of this approach is that it is much easier for users to work around problems and get help when things go wrong—especially during partial failures. The user can see exactly what the tool was doing when things went wrong, which helps both them and the platform team understand what steps you need to take to fix the problem.
Rely as little as possible on what is installed on the host or remote servers
A question teams typically have when they start getting serious about building platform tools is what programming language or runtime they should use to build these tools.
I am not interested in lengthy debates about which programming language is the best one—well, not anymore. I believe that an engineer should become familiar with as many programming languages and paradigms as possible and make a decision about which one to use for a specific project based on the constraints under which they work. In my experience, the primary constraint is always on the people side, either picking something that your team can be productive on very quickly and that you can find good candidates when you need to grow your team.
When it comes to building platform tools, though, there is one other constraint that is always present: your tools should have as few moving parts as possible.
Back to the work we’ve done at SoundCloud, we first built most of our Docker-based tools previously discussed here using Bash scripts. As it always happens, at some point Bash becomes hard to scale and test, and we need to pick a new platform. The team had experience in Python and Ruby, so we started building our tools in these two languages. At first, this worked well, as both are very productive and have a vast amount of libraries, testing tools, and real-world examples we could leverage.
Soon enough, though, we started having some issues. Every engineer already had some version of both Python and Ruby installed on their laptops, but the same wasn’t necessarily true for our servers, build boxes, and the laptops from product managers, designers or any other non-engineering folks who might need to perform a small infrastructure task as part of their job.
However, even engineers were having issues. They would need to keep and manage many different versions of these runtimes. Our legacy Rails application required a specific version of Ruby, some new services required their own versions, and our tools would run on another version. Even if tools like rbenv and RVM make it possible to manage these things, way too often people would report problems when using our tools that were caused by the user mistakenly running the tool against the wrong version of runtime or library.
We tried solving this using package managers like APT and Homebrew, but it felt like adding more overhead and friction to our users. We then packaged all of our tools as Docker containers and made it such that every time a tool was invoked, it would just execute docker run on a container image that we had baked. This setup worked ok enough for a while, but it was a massive performance hit for a tool that was supposed to run and finish quickly, and it also required a very long set of configurations and conventions to map networking and filesystem between localhost and the Docker container.
When I was at DigitalOcean, we released a command-line tool to our customers distributed as a single binary. It was a natural choice for us back then, as DigitalOcean builds systems almost exclusively using Go, and this is how binaries are distributed on this programming language. This distribution style was very successful, as all that our users needed to do to use our cloud was download this one executable file, as opposed to the multi-step process that AWS requires when installing their Python-based command-line tool.
Go isn’t the only modern language that can produce reasonably small executable binaries, and other options like Rust are getting more and more traction amongst platform teams. Irrespective of what programming language you pick, make sure that the resulting executable is self-contained, that it doesn’t require users to install any runtime or virtual machine on their computers.
At Meetup, we followed this principle for all of our command-line tools, but we had a big challenge in that our tooling required the aws command-line tool to be installed by the user. We assumed that proper feed and care of the aws tool was a reasonable expectation to have on our engineers, and added a lot of checks to make sure that our tool would detect and let the user know when there was a problem with their local AWS installation—see the health check section below.
It is very common for platform tools to interact with systems like CloudFormation, Terraform, and Kubernetes, which require their users to write configurations on files written in JSON, YAML, or another declarative language. These templates need to be stored somewhere. One approach is to keep them on a remote location, such as an S3 bucket or Maven-style repository. I have found this approach problematic for a few reasons.
Firstly, it adds another moving part to your toolset, which is undesirable. This architecture requires this remote location to be always accessible, which implies high-availability needs, on-call support, incident management, etc.
It also adds some overhead on versioning. Command-line tools make some assumptions about the templates about things like which parameters they expect. If you change the template, you need to think about how this change could impact all possible versions of the command-line installed in laptops, buildboxes and elsewhere.
Both issues arise from the fact that the command-line tool and the templates are highly coupled. In general, it is advisable to keep two highly coupled components together, as part of the same artifact. When it comes to platform tools, my suggestion is that you embed the templates within the command-line binaries, using tools like Packr.
Have a built-in self-check
When I was at Buoyant, our tiny engineering team split our time between working on Linkerd v2 and supporting the hundreds of users of the first version of our Service Mesh. We had an on-call rotation for support, and engineers would rotate on helping our community on forums, Slack, and help with issues they had found.
Something that one finds out when doing user support for open-source products is that you spend most of the time trying to figure out if the issue is caused by something in the user’s environment or in your product. As we were an open-source project, we couldn’t ask for access to the users’ systems and had to rely on asking them questions on a public forum. This slow-paced interaction made the process take forever.
That is why one of the first features we built for Linkerd v2, while it was still called Project Conduit, was a self-check that would try to make sure that some basic requirements were in place. Inspired by Homebrew’s doctor command, we tried to give as much information to the user as possible so that they could maybe fix the problems themselves before asking on the forum.
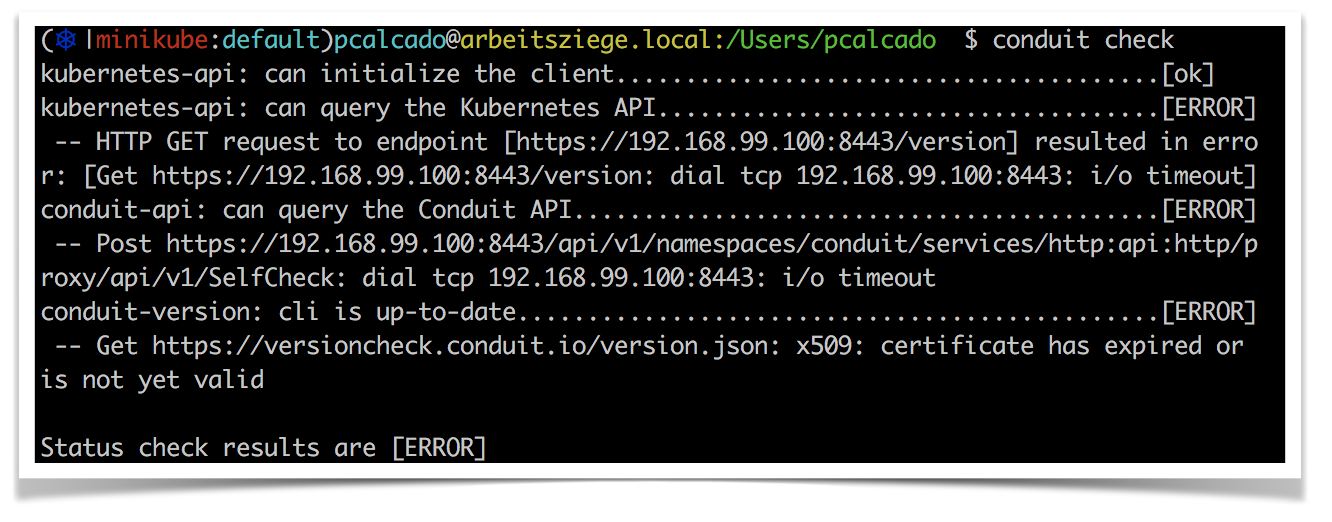
But even when people couldn’t fix their own issues, the first thing we did when people had issues was to ask them to paste the output of this command. This gave the support engineer a lot of useful information from the beginning, instead of having to ask lots of questions over a long period of time.
This check feature is something that I like to have in my internal tools. Similarly to people working on open-source software, a platform team invest a lot of time helping their users understand issues they might experience. This is a built-in way to help users help themselves or, at least, give the platform team some more context on why a problem might be occurring.
One similar but maybe more important verification is making sure that the user has an up-to-date version of the tools. This is part of the check feature discussed above, but I recommend that this important check should be part of every command.
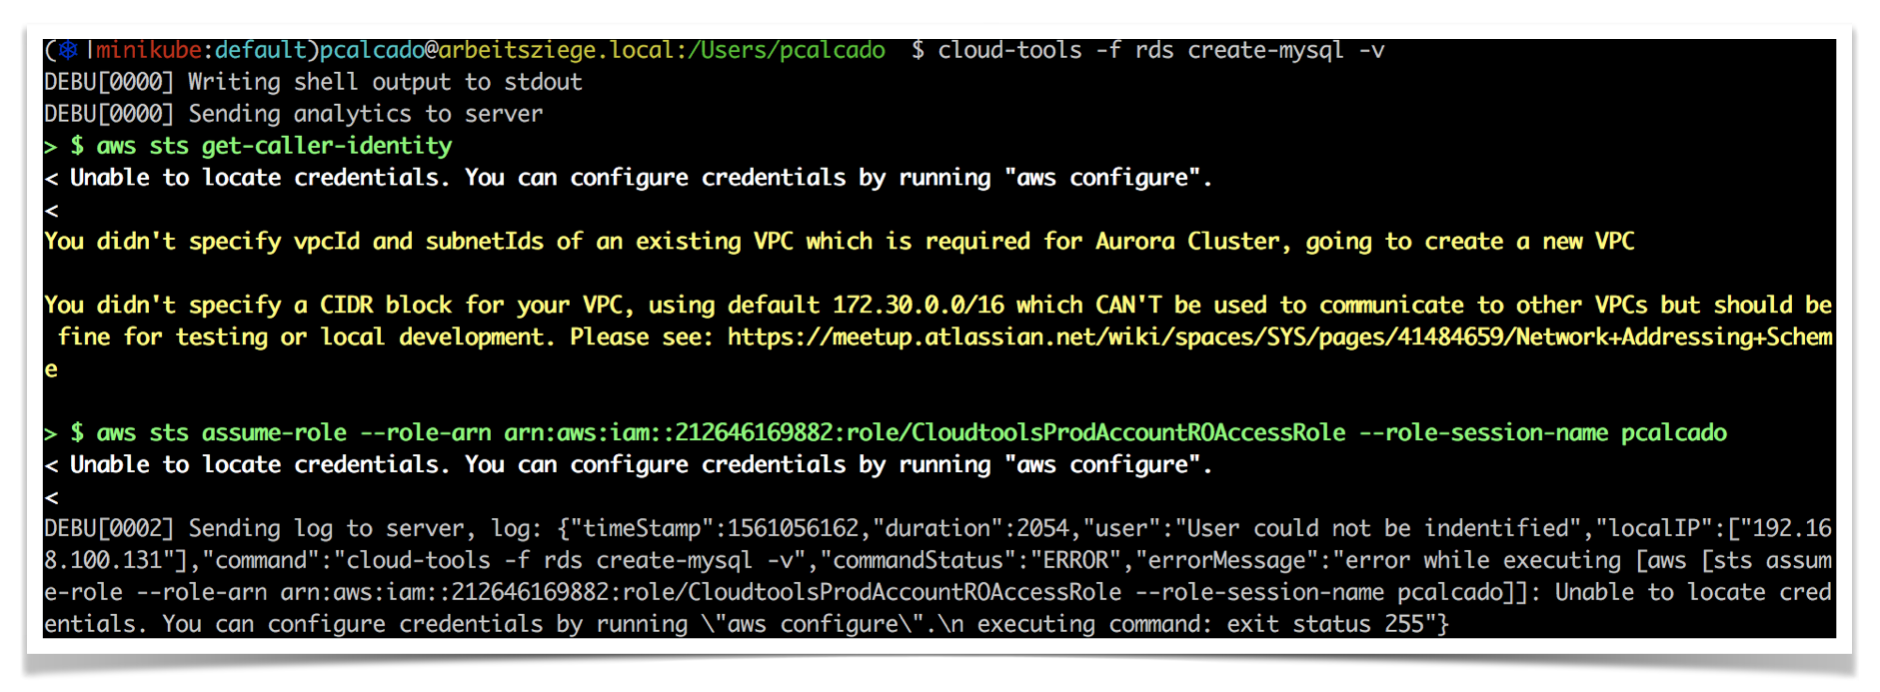
As an example, here is a failed attempt at creating an AWS account using the tool we built at Meetup. You can see that as part of its normal operation, the tool also queries an S3 bucket that contains the latest version number so that it can compare against its own version:
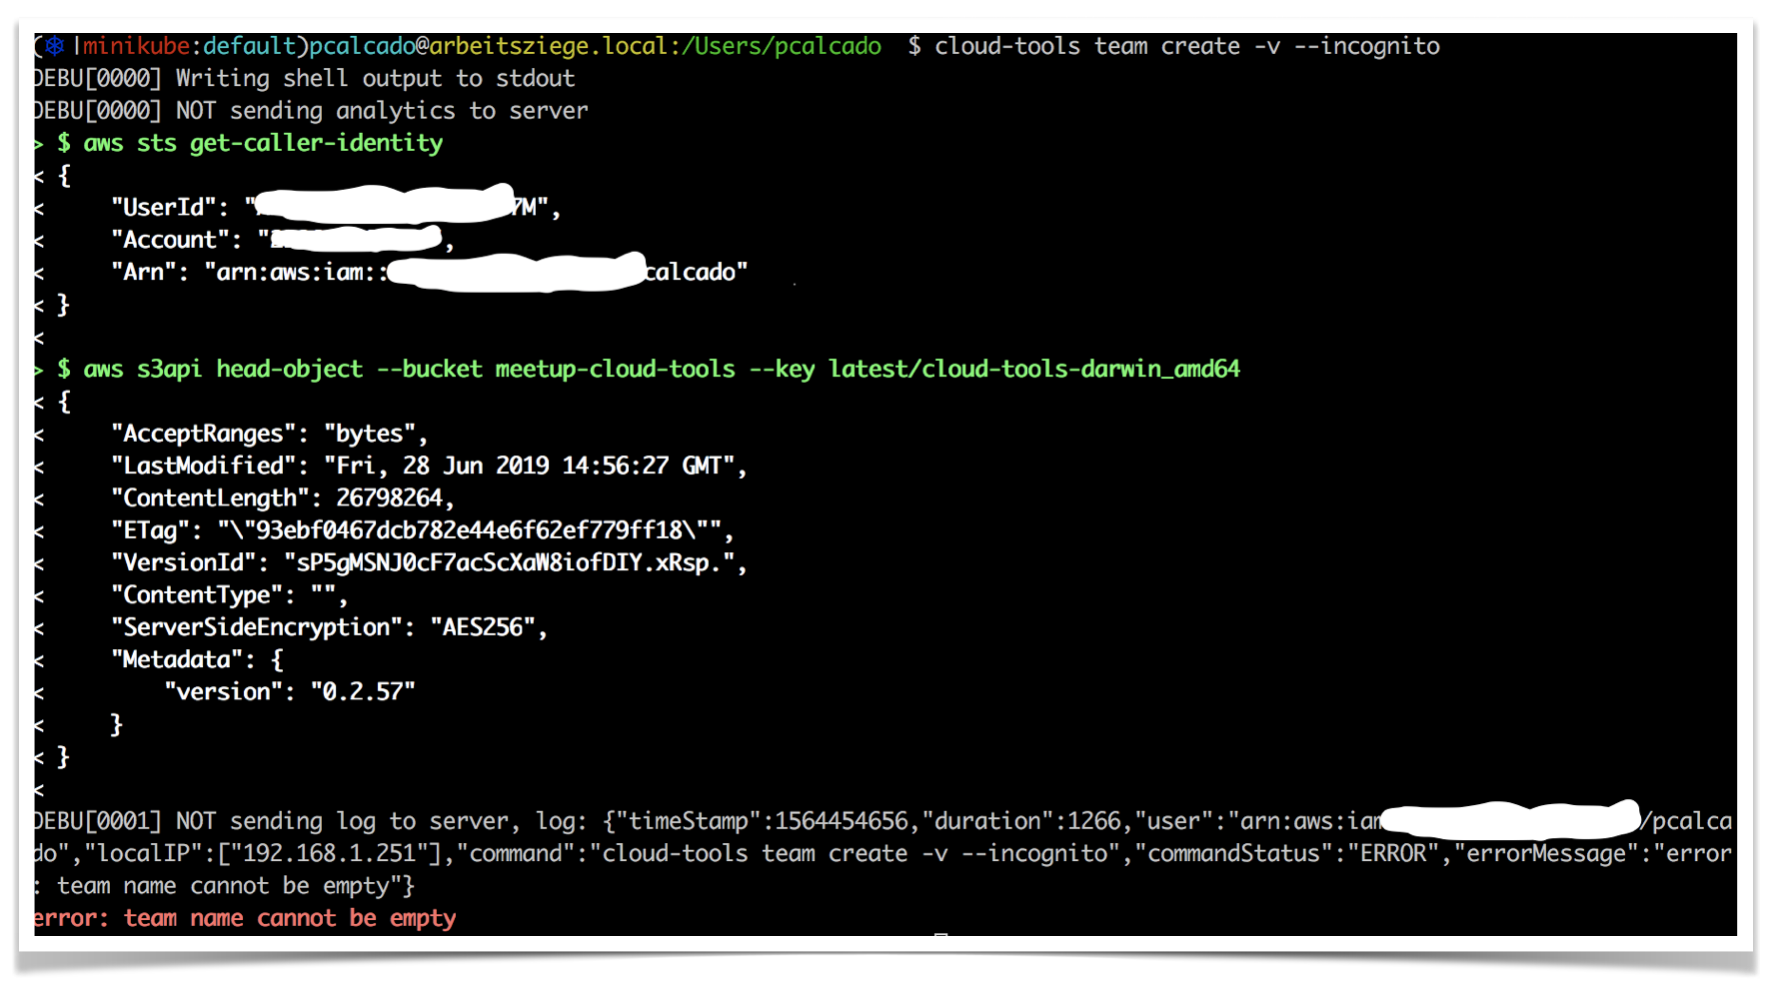
Ideally, the S3 bucket above should also inform what the minimum acceptable version is. If the current installation of the command-line tool is older than this version, it should reject any commands and ask the user to update the tool. If the current version is older than the most recent release but still higher than the minimal acceptable version, it should display a warning but still execute the command.